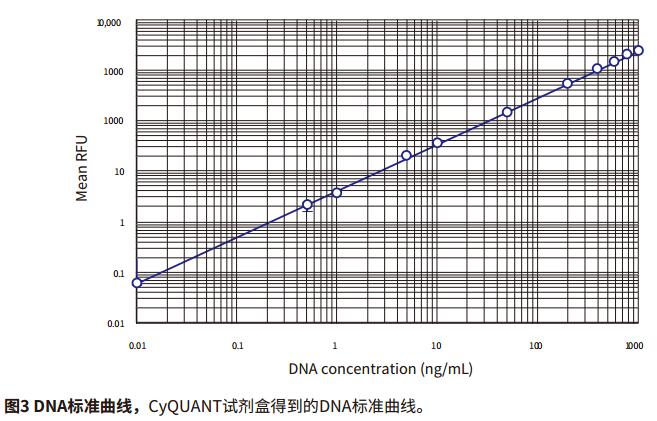
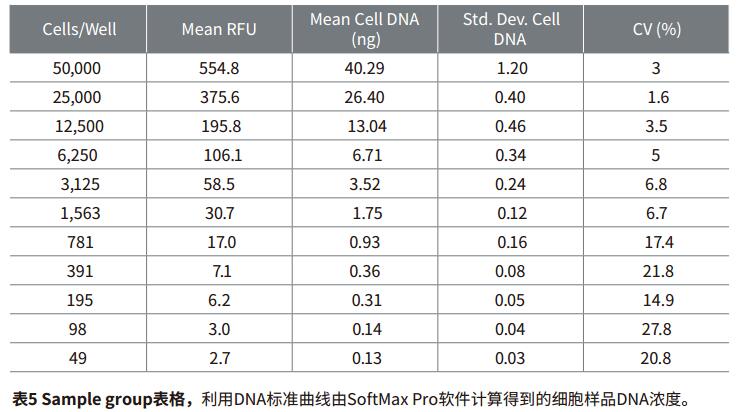
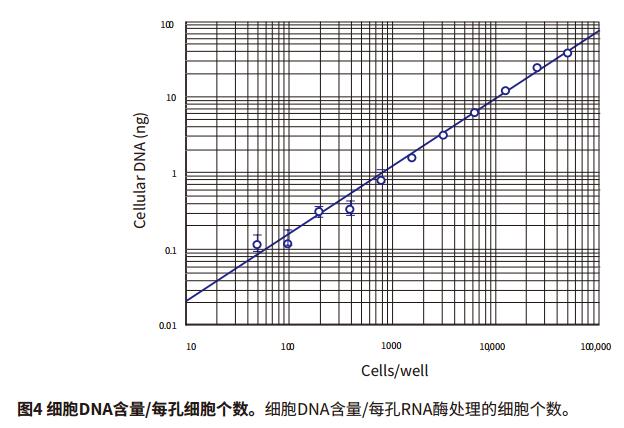
Introduction Quantification of cell proliferation by fluorescence can be used to quickly and easily detect the effects of drugs or other experimental treatments on cell growth. Life Technologies' CyQUANT Cell Proliferation Kit is a highly sensitive, reproducible and simple method for performing fluorescent microplate assays. The GR dye of CyQUANT can be labeled on the nucleus and the number of cells counted by fluorescence. The ratio of DNA to RNA changes with the cell cycle. Therefore, the CyQUANT kit can be used as a standard curve by RNase lysate and nucleic acid amount. This application describes how to detect cell proliferation using the CyQUANT kit and Molecular Devices' SpectraMax microplate assay system and SoftMax® Pro software. Two methods were introduced, one is a cell-based method, and the other is to prepare a DNA standard curve by dissolving a cell sample with RNase. Advantage - Rapid and convenient quantitation of cell growth material - CyQUANT Cell Proliferation Kit (Life Technologies cat. # C7026): Component A, 400X CyQUANT GR dye; component B, 20X cell lysate; component, 100 μL λ DNA standard sample solution at a concentration of 100 μg/mL Note: Cells The solution and dye should be used within a few hours after dilution. The CyQUANT GR dye solution should be stored away from light. Cell preparation The adherent or non-adherent cells of the CyQUANT assay can be cultured directly in a microplate and then frozen, or the cells cultured in a culture dish, and then the frozen cell sample transferred to a moving microplate. For detailed procedures, please refer to the CyQUANT Cell Proliferation Kit Product Specification MP-7026. Cell-based CyQUANT assay Preparing cells Step 1: The adherent cells were digested with trypsin or EDTA solution, and the cell suspension was diluted with the medium at a concentration in the table and placed in a 96-well plate. The control group was a cell-free medium. Prepare cell samples for standard curve Note: It is best to use the same type of cell type as the standard curve used in the experiment. Step 1: Digest the adherent cells with trypsin or EDTA solution and dilute the cell suspension to 105-106 cells/mL with medium. Preparation reagent Step 1: Prepare 1X cell lysate, dilute the cell lysate stock solution with distilled water at 1:20, and prepare 200 μL per well. Prepare standard curves and samples based on cell method Step 1: The previously detached cells were thawed at room temperature for a few minutes. Add 1 mL of CyQUANTGR stain/cell lysate and vortex to resuspend the cells. Assuming 106 cells, the cell lysate is equivalent to 106 cells/mL. Set instrument and software parameters Step 1: Open the microplate reader switch, open the SoftMaxPro software and click CyQUANTFluorescenceprotocol in the CellGrowth&Viability folder in the ProtocolLibrary. data analysis Step 1: If the template is set, after the microplate reads, the calculated result will automatically appear in the Grouptable. Cell-based standard curve results The cell-based standard curve is presented in Figure 2 as previously described. A log-log fitting algorithm was used to generate the standard curve. The results shown in the figure were obtained by the SpectraMax M5 microplate reader. Other fluorescence-reading readers from Molecular Devices found similar results (data not shown). ). Table 3 shows the results of the proliferation data of the CHO-K1 cell samples listed in Table 1 for two days, and the cell proliferation results of the next day of culture were calculated by SoftMaxPro software using a cell-based standard curve. Cyzyme treatment, CyQUANT assay based on DNA content Cell proliferation can also be assessed using DNA content and a standard curve is made. The DNA content can be calculated from the cell curve, and the lysate of the cell lysate excludes the interference of the RNA on the result. In this application note, the setup steps for quantifying a sample of cells using a standard curve of DNA content are listed. Preparation reagent Step 1: Prepare 1X cell lysate, dilute the cell lysate stock solution with distilled water at 1:20, and prepare 200 μL per well. A portion of the cell lysate was added to 1 mM EDTA and 180 mM NaCl, and a portion was not added with EDTA and NaCl. Preparation of DNA standard samples in plastic tubes Step 1: Dilute 100 μg/mL DNA standard sample in the kit with 1X cell lysate and dilute to 1 μg/mL stock solution. Preparing cells Depending on the cell line used (adherent or non-adherent), appropriate cell culture (in a microplate or in a culture dish) and cryopreservation method were selected according to the Life Technologies CyQUANT instructions, and the cells were frozen at -70 °C. In this paper, adherent cells are first digested from the culture dish, then centrifuged, and the centrifuged cell plaques are frozen. Prepare cell samples, standard curve DNA samples, and blanks Step 1: The previously detached cells were thawed at room temperature for a few minutes. Add 1 mL of CyQUANTGR stain/cell lysate and vortex to resuspend the cells. Set instrument and software parameters Step 1: Open the microplate reader switch, open the SoftMaxPro software and click CyQUANTFluorescenceprotocol in the CellGrowth&Viability folder in the ProtocolLibrary. Reading board and data analysis Step 1: Place the microplate in the plate reader. DNA standard curve result The cell-based standard curve is presented in Figure 3 as previously described. A log-log fitting algorithm was used to generate the standard curve. The results shown in the figure were obtained by the SpectraMax M5 microplate reader. Other fluorescence-reading readers from Molecular Devices found similar results (data not shown). ). An example of using RNase to treat cells to detect DNA content as a standard curve is shown in Table 5. In this application note, the cell concentration of a series is calculated. In fact, the cell DNA concentration can be calculated by this method in the number of cells per well between 50 and 50,000 (within the range of the standard curve). Figure 4 shows that the abscissa is the number of cells per well, the ordinate is the average DNA content, and the curve ranges from 50 to 50,000 cells. The results are as described in the kit instructions. A comparison of RFUs values ​​for RNase treated and untreated cell samples is shown in Figure 5, indicating that RNase treatment reduces the fluorescence intensity of the cell lysate. to sum up The CyQUANT cell proliferation assay is a rapid, sensitive method for detecting the number of cells and the amount of cellular DNA. The results obtained with the SpectraMax M5 Microplate Reader were similar to those obtained with other fluorescent readers from Molecular Devices. Based on the cell-based standard curve and 5 minute incubation, we obtained a similar dynamic range (50-50,000 cells) as the CyQUANT kit. The curve obtained using the lambda DNA sample and the lower limit of the DNA content were calculated from the standard curve of 50 cells. Combined with SoftMaxPro's software analysis capabilities and preset CyQUANT shooting settings, it provides a convenient way to calculate and get data. references 1. Life Technologies Product InformationsheetMP 7026 1/12/01: CyQUANT CellProliferation Assay Kit (C-7026). Bifidobacterium Bifidum,Bifidobacterium Bifidum Powder,Bifidobacterium Bifidum Probiotic,Bifidobacterium Bifidum Supplements Biodep Biotechnology Co. ,Ltd. , https://www.mbioda.com
- Sensitive detection of as few as 50 cells
- Easy data analysis with preconfigured SoftMax Pro Software protocol
- Cell line: CHO-K1 cells (ATCC # CCL-61)
- EDTA solution (Fisher Chemicals cat. # S311-100)
- NaCl solution (Fisher Chemicals cat. # S271-500)
- DNase-free RNase A or RNase mixture (Ambion cat. # 2286)
- Black bottom 96-well plate (Corning cat. # 3603)
- SpectraMax Microplate Reader with Fluorescence Detection Module (Molecular Devices)
Step 2: The well plates were placed at 37 ° C until the time of proliferation was detected. The incubation time depends on the cell type, the type of proliferation assay, and the purpose of the experiment.
Step 3: Aspirate the cell culture medium in the well and wash it once with PBS. If the cells are not attached, do not wash.
Step 4: Place the well plate at -70 °C until the cells are frozen (at least one hour, up to several weeks). The freezing step facilitates complete lysis of the cell sample. 
Step 2: Centrifuge 5 g of a 1 mL cell suspension (about 1,500 rpm) for 5 minutes, discard the supernatant, and centrifuge the cells at -70 °C until the assay. The freezing step facilitates complete lysis of the cell sample. 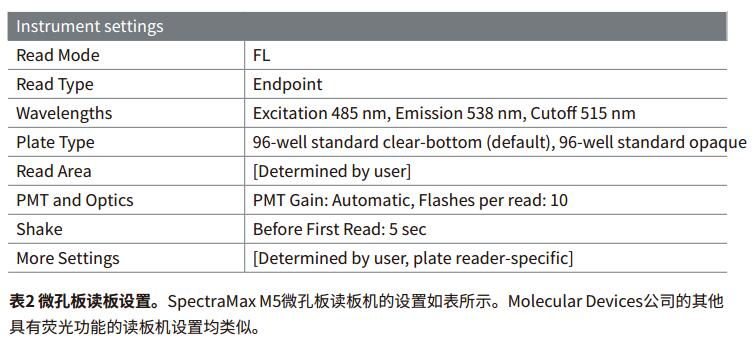
Step 2: 1X CyQUANT GR stain/cell lysate was prepared and the CyQUANT GR stain solution stock was diluted 1:400 with 1X cell lysate. The dilution should be placed in a plastic dish, not in a glassware. 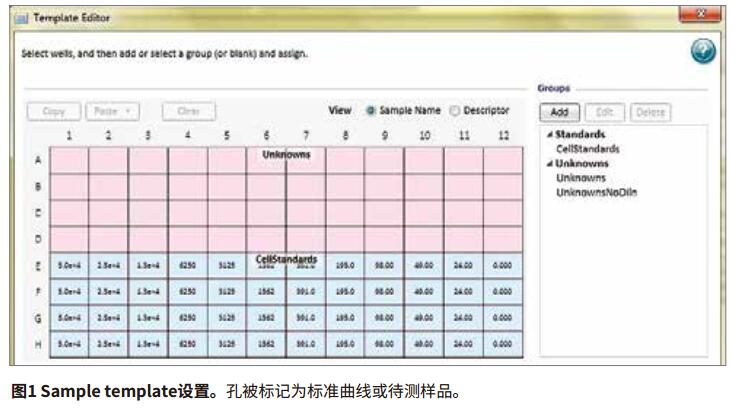
Step 2: Place the cell suspension in a well plate with a 1:2 dilution gradient up to 50,000 cells/mL and a minimum of 24 cells/mL. CyQUANTGR stain/cell lysate was added to give a final liquid volume of 200 μl per well. Four replicates per concentration and several control groups (no cells) were placed in the vacant wells.
Step 3: Place the microplate in the dark for 2-5 minutes at room temperature. 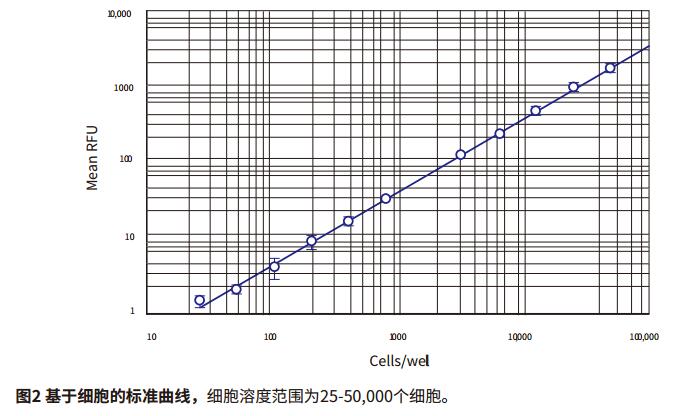
Step 2: Set up the instrument as shown in the table, this setting is already in the pre-configured list.
Step 3: Use the TemplateEditor to set the template for the plate loading, including the standard sample wells (number of cells per well), blank control wells (no cells), and the location of the sample wells. The columns set by the template are shown in Figure 1. Note that clicking on the Ctrl and Shift keys simultaneously will display the settings for each hole. The sample name (Un01-Un02) does not appear in the figure shown.
Step 4: Place the microplate in the plate reader. If your reader reads an adapter (such as SpectraMaxM5), place the adapter before placing the sample.
Step 5: Click on the Read button of the software and the instrument will read the microplate. The relevant fluorescence values ​​(RFUs) will appear in the software plate position.
Step 2: If the standard curve group is set in the TemplateEditor, the standard curve will be automatically generated by the software. The Fit Curve formula can be selected in the CurveFit drop-down menu. The standard curve for this application describes the log-log curve fit (Figure 2). It is also possible to use a quadratic curve.
Step 3: Calculate the number of cells per well of the experimental sample. The software calculates the concentration of each experimental sample using the standard curve formula and displays it in the Unknownsgroup section. 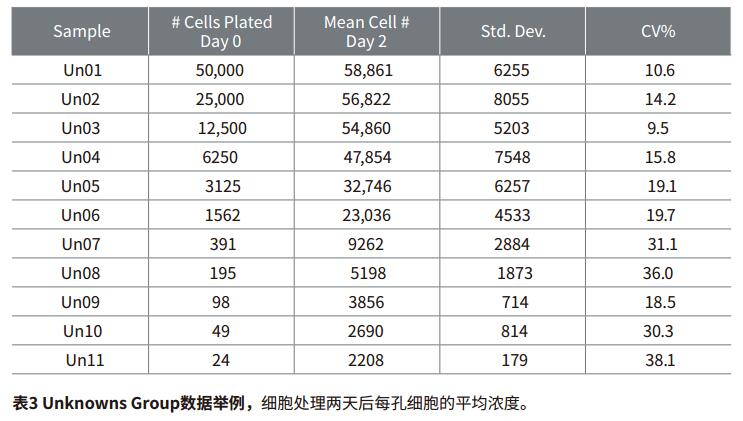
Step 2: Prepare 1X and 2XCyQUANTGR stain/cell lysate and dilute the CyQUANTGR stain stock solution with 1X cell lysate at 1:400 or 1:200. The dilution should be placed in a plastic dish, not in a glassware.
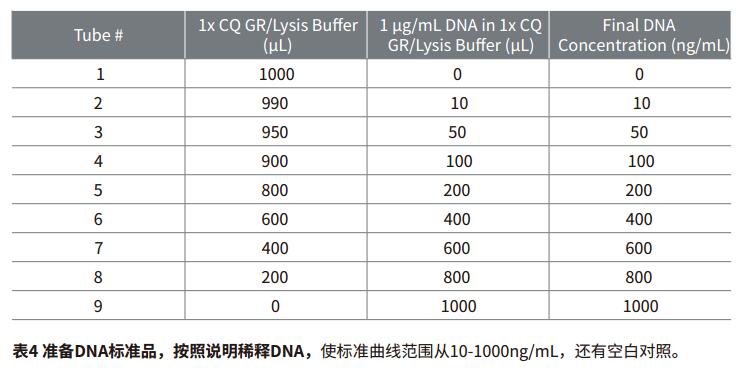
Step 2: The DNA stock solution was diluted by gradient as listed in Table 4.
Note: The λ phage DNA is in the CyQUANT kit and the data in this article are all diluted by standard gradients. For your own experiments, you can also choose DNA samples from other sources. For details, please refer to the product manual MP-7026.
Step 2: Pre-treat the cells, add cell lysate containing 1 mM EDTA and 180 mM NaCl to each well, and add the same cell lysate (blank control well) to the wells without 4 cells. If the sample is a previously frozen cell pellet, it is first resuspended in 100 μL of lysate and transferred to a microplate. 4 μL of RNase (two units per well, see below) was added to the sample wells and blank control wells with cells. Incubate for 1 hour at room temperature.
Note: DNase-free RNase treatment of cells contains no more than 10 μL of saturated active units. For example, the kit has a mixed RNase concentration of 500 U/mL, so there are two active units per 4 μL.
Step 3: 100 μL of 2XCyQUANTGR stain/cell lysate was added to the cell-containing sample well and the blank control well, respectively.
Step 4: The previously prepared DNA gradient dilution was sequentially added to the microplate. The well plate contained two controls, one was a blank without a DNA, and the other was a 1XCyQUANTGR solution. / Cell lysate plate blank control (no DNA and RNase).
Step 5: Incubate for 2-5 minutes at room temperature
Step 2: Set up the instrument as shown in Table 2, this setting is already in the pre-configured list.
Step 3: Use the TemplateEditor to set the template for the plate loading, including the standard sample wells, the well blank control wells, and the sample wells (RNase-treated cells).
Step 2: Click the Read button of the software.
Step 3: After the instrument will read the microplate, the relevant fluorescence values ​​(RFUs) will appear in the software plate position. The data will be analyzed according to the settings and displayed in Grouptables.
Step 4: If the standard curve group is set in the TemplateEditor, the DNA standard curve will be automatically generated by the software.
Step 5: In the CurveFit drop-down menu, you can select the fit curve formula. The standard curve for this application note selects the log-log curve fit.
Step 6: The software calculates the concentration of each DNA sample by the standard curve formula and displays it in the Unknownsgroup section. 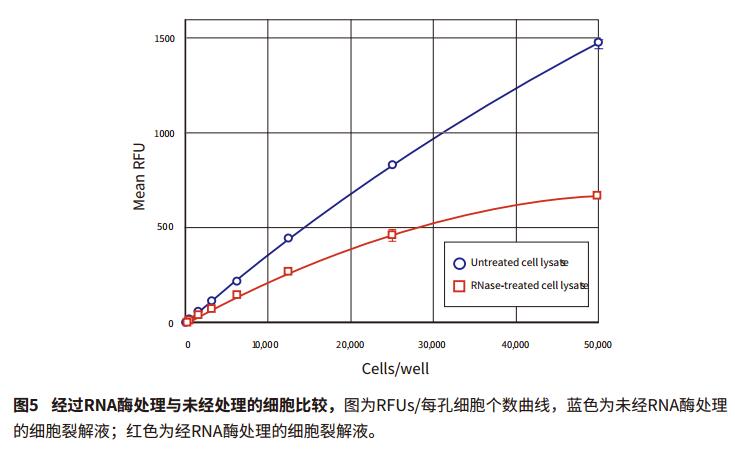

Detection of cell proliferation using the SpectraMax microplate assay system and the CyQUANT kit
